All over the country, concerns about inflation are dominating the news cycle. Given the way this issue is sure to impact clients, we’ve decided to provide our thoughts on the matter. Specifically, here’s why we think inflation will begin to temper as we move through 2022.
First things first, let’s discuss the elephant in the room: why are we seeing levels of inflation that are higher than what we’ve seen in the past 20 years? Though the answer to this question could be a conversation in and of itself, we think one of the biggest reasons is that Americans have simply changed how they spend money.
SPENDING AND THE PANDEMIC
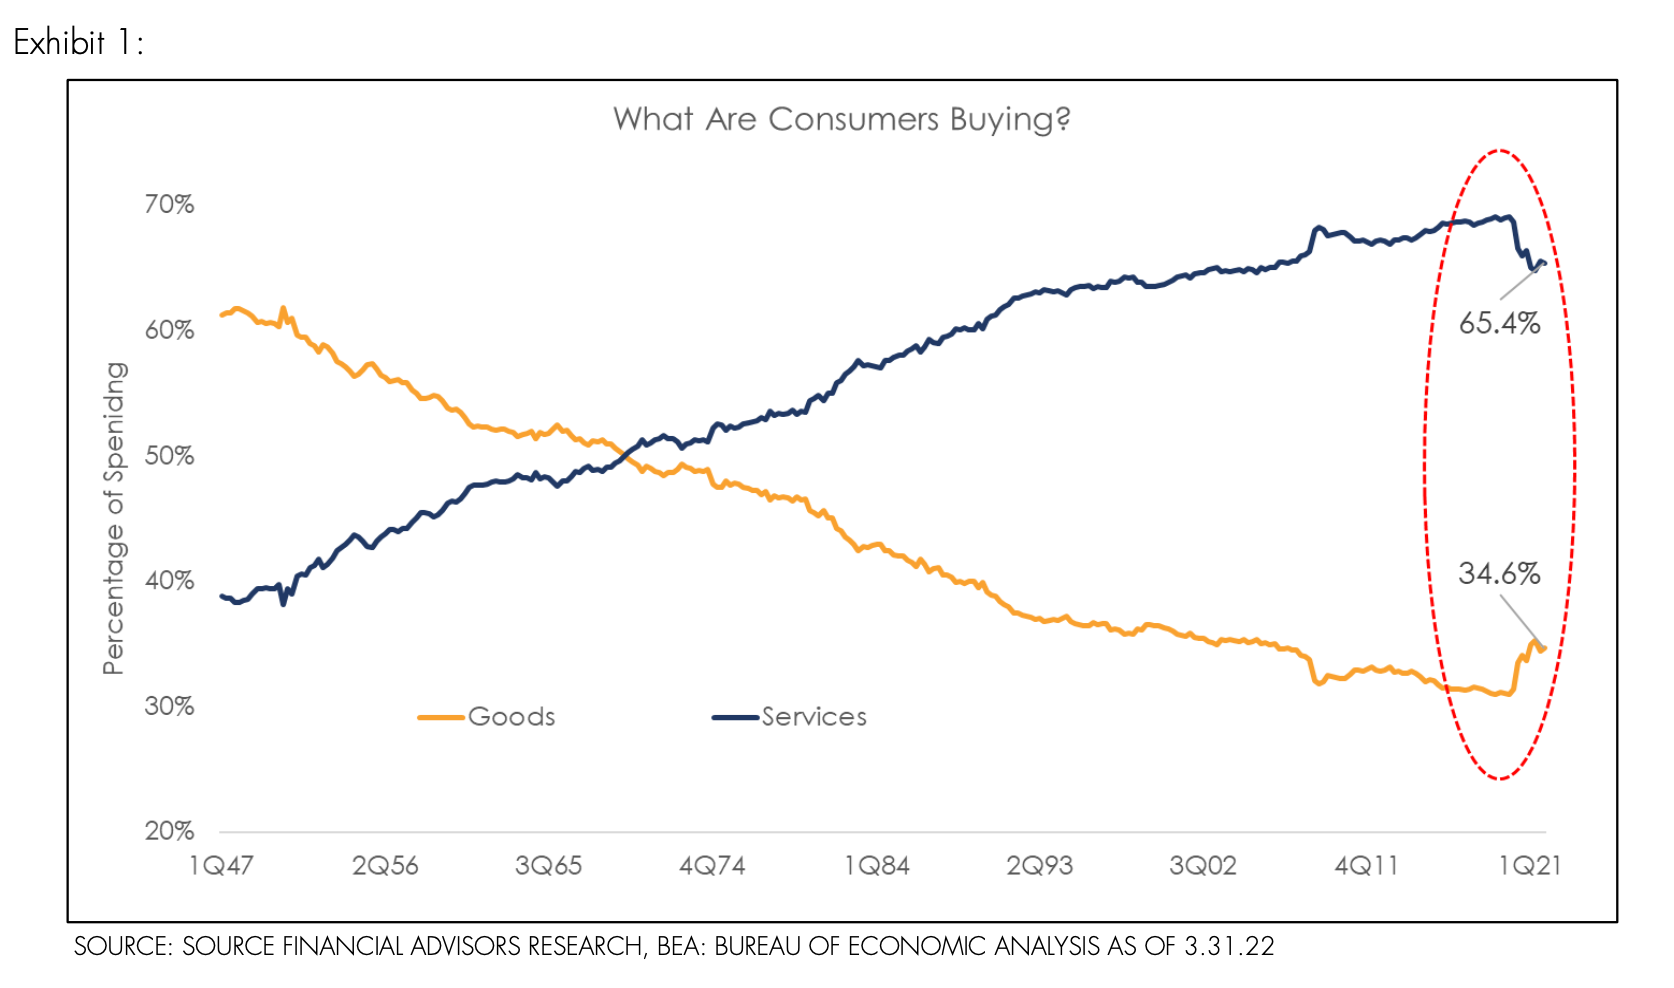
Take a look at Exhibit 1 below. As you can see, over the past 75 years, American consumer spending has had a clear, distinct trend line. That is, there has been a lot more spending on services and a lot less spending on goods. You might say we as a country have been putting more money toward experiences than things. This trend has been so pronounced, in fact, that by the end of 2019, $0.70 of every dollar spent was going towards services, leaving just $0.30 for goods.
Yet, in March of 2020, this 70-year trend not only stopped abruptly, but quickly began moving in the other direction. As a country, we began spending more on goods than on services for the first time in nearly a century due to the onset of the COVID-19 pandemic, which was accompanied by mass shutdowns, mandates, and quarantining. To state the obvious: the Pandemic changed everything.

[Exhibit 1. Click image to enlarge]
SOURCE: SOURCE FINANCIAL ADVISORS RESEARCH, BEA: BUREAU OF ECONOMIC ANALYSIS AS OF 3.31.22
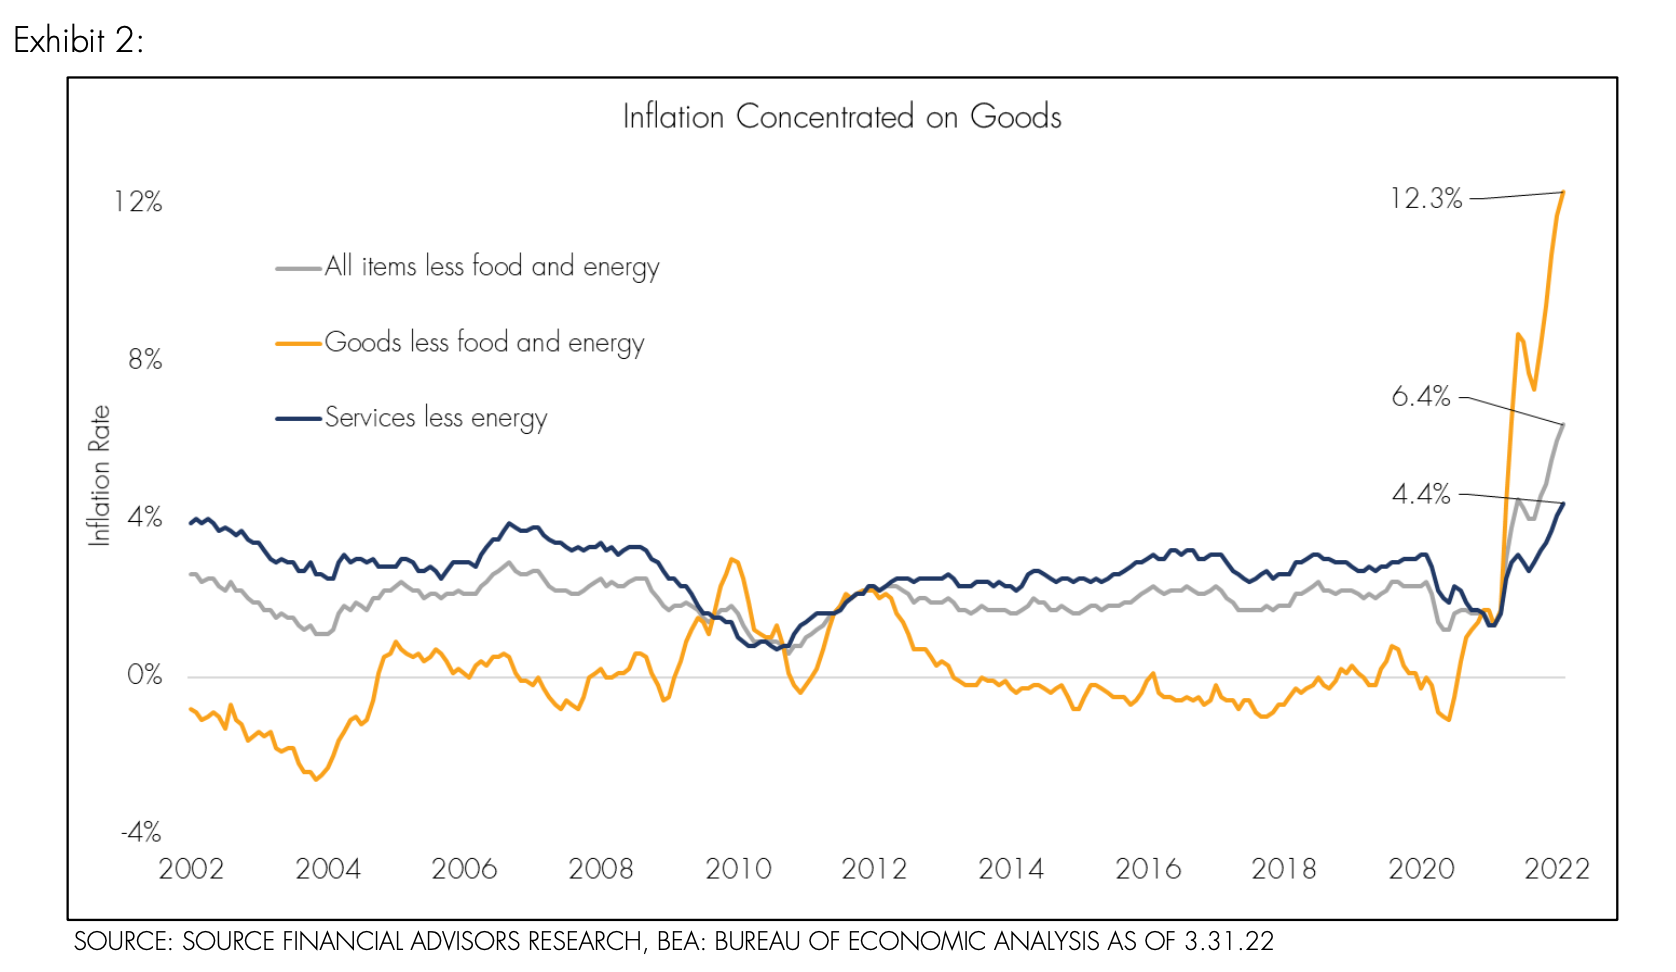
When dramatic shifts in spending habits occur, it creates what economists call a “demand shock.” Simply put, when the pandemic hit, people were suddenly eager to buy things while virtually ignoring experiences. Historically, demand shocks like this have led to inflation within the US economy, which is exactly what happened. Overall inflation is made up of two key components: goods and services. If you look at the graph in Exhibit 2 you can compare changes in each.

[Exhibit 2. Click image to enlarge]
SOURCE: SOURCE FINANCIAL ADVISORS RESEARCH, BEA: BUREAU OF ECONOMIC ANALYSIS AS OF 3.31.22
As you can see, overall inflation (the gray line) is up over 6% this year. If you look at Goods Inflation (the orange line) you’ll note a very distinct spike that has risen to above 12%. In the meantime, services inflation (the blue line) remains at a manageable 4.4%2. What does this tell us? Well, it means that there was a rush to buy goods that pushed Overall Inflation up. Therefore, if Americans were to start spending money on services again, the Overall Inflation trend should come back down.
Of course, it’s important to be cautious when attempting to extrapolate this rapid increase in goods inflation into an indicator for long-term inflation. For instance, we seem to be approaching the end of the pandemic, with global vaccination rates rising steadily throughout the beginning of 2022. At the time of this writing, some 3.5 billion people have been vaccinated3, which is sure to reduce COVID’s ability to disrupt the global economy.
Still, the big question remains: is the demand shock we’ve experienced temporary or more permanent? Will Americans eventually return to their historical spending patterns, or has the pandemic simply changed how we spend money forever?
In our opinion, the former is far more likely. In fact, if you look closely, almost all of the changes in American spending habits can be traced back to the pandemic in one way or another. With the service economy closed, nowhere to go out to eat, or to travel, Americans had no choice but to spend their money on goods. As that becomes less and less the case, we should soon see a return to normalcy.
MOVING FORWARD
So, what about near-term and long-term inflation? As stated, we think that COVID’s waning influence will help facilitate a return to normal – that is, more spending on services. As the spending on goods decreases, the demand shock we’ve been experiencing will most likely subside. In due time, this should cause inflation to decrease.
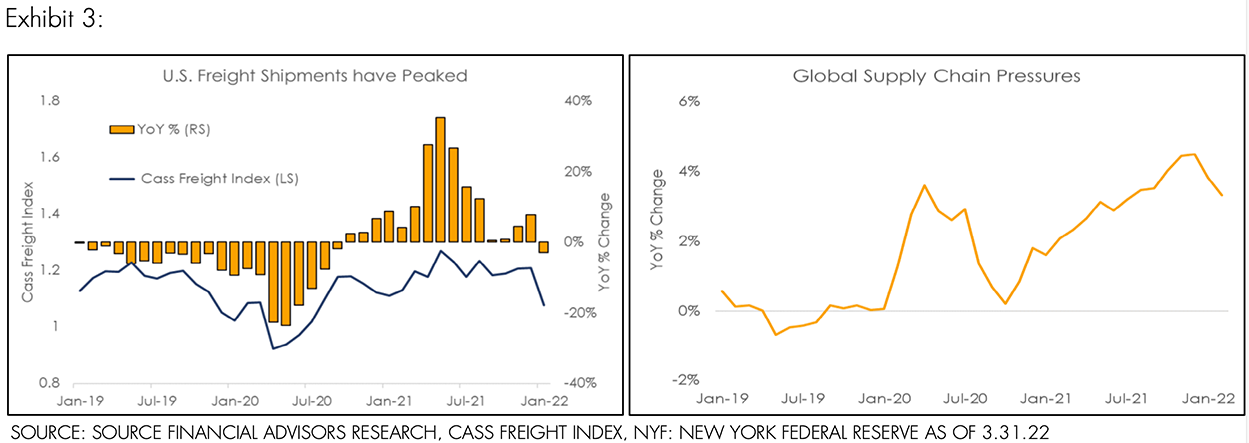
And while it’s still early in the game, the available data is already showing some evidence of this. For instance, if you look at the case freight index4 (which gauges trucking costs) and the NY Fed Global Supply Chain Pressure Index (Exhibit 3)5, you’ll see both have peaked and are backing off from their previous highs. If these trends continue, they should soon translate into a reduction in near-term goods inflation.

[Exhibits 3-4. Click image to enlarge]
Now, if you want to model the medium or long-term effects on inflation, you’re better off identifying the factors that drove the low inflation we‘ve had over the past decade. For our purposes, this can be broken up into two trends: global supply chains and technology.
For starters, let’s look at what’s known as the “Walmart” and “Amazon Effect.” If you take a step back and look at why these companies have achieved market domination, it’s easy to see that it’s because they typically have the lowest price. As they grew, they pushed prices down by pushing down the cost of production (deflation). And while talk of re- domesticating our supply chain is all the rage, the evidence of this is hard to find, meaning that global supply is likely to continue and potentially expand.
On the other side of the coin, there have been significant changes in technology over the past decade. This has done a great job of optimizing existing industries so that they can do the same job at a lower price. Take companies like Uber and Lyft, for example. They aren't providing something new, but they’ve achieved success by using technology to repackage an existing industry into a cheaper alternative. Again, this is a form of deflation. As time goes on, technological advances should continue to push down the cost of industry.
In summary, if we were to attempt to predict whether we will have higher inflation in the medium or long term, we need to look at what lowered inflation over the past ten years and attempt to determine if it will continue to be a factor or not. In our opinion, neither global supply chains nor technology are going anywhere. If anything, they are and will become more prevalent than ever, making consistently high inflation unlikely in the long-term.
Sources:
1 SOURCE: BEA: BUREAU OF ECONOMIC ANALYSIS AS OF 3.31.22
2 SOURCE: BLS: BUREAU OF LABOR STATISTICS AS OF 3.31.22
3 SOURCE: JOHNS HOPKINS CORONAVIRUS RESOURCE CENTER AS OF 3.31.22
4 SOURCE: CASS INFO SYSTEMS: https://www.cassinfo.com/freight-audit-payment/cass-transportation-indexes/february-2022
5 SOURCE: NEW YORK FEDERAL RESERVE: https://libertystreeteconomics.newyorkfed.org/2022/03/global-supply-chain-pressure-index-march-2022-update/
DISCLOSURES
Past performance is no assurance of future results. Source Financial Advisors, LLC (“Source”) is a registered investment adviser with its principal place of business in the State of New York. Opinions expressed are those of Source and are subject to change, not guaranteed and should not be considered recommendations to buy or sell any security. Any reference to a chart, graph, formula, or software as a source of analysis used by Source staff is one of many factors used to make investment decisions for your portfolio. No one graph, chart, formula, or software can in and of itself be used to determine which securities to buy or sell, when to buy or sell them, or assist any person in making decisions as to which securities to buy or sell or when to buy or sell them. Any chart, graph, formula, or software used is limited by the data entered and the created parameters. The data was obtained from third parties deemed by the adviser to be reliable. Nonetheless, the adviser has not verified the results and cannot be assured of their accuracy.
